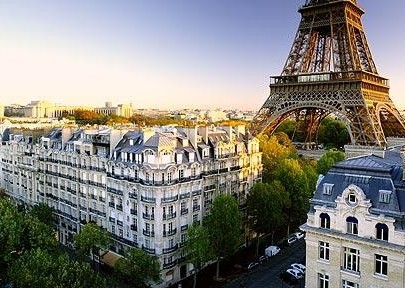
Growth of Luxe Properties: Paris Overtakes Asian Cities
Photo: courtesy ofTelegraph UK The gap between the performance of European and Asia’s top cities has narrowed considerably compared to last year. According to London-based Knight Frank Residential Research, Paris […]

Photo: courtesy ofTelegraph UK
The gap between the performance of
European and Asia’s top cities has narrowed considerably compared to last year.
According to London-based Knight
Frank Residential Research, Paris came out at a mighty 22% growth rate (see bottom for complete list), leading
Hong Kong by 7 percentage points.
Liam
Bailey, head of Residential Research at Knight Franks, offers “Investors from
the BRIC nations are increasingly looking to Paris as a safe haven to invest
funds in a mature and high-performing market. Like London, supply is hindered
by a paucity of new-build developments as the proportion of units allocated to
social housing often makes luxury new developments unviable: the simple fact is
that, with a few infill exceptions, the opportunity to build ‘another Eaton
Square’ is almost non-existent”.
Whereas
Hong Kong, Shanghai, Beijing and Singapore recorded a 54.6% growth rate in Q1
2010, QI 2011 saw the price growth of these prime housing markets slip by 80%
to 11.1% in QI 2011. The most obvious reason is the governments’ cooling
measures, yet Bailey offers a more intricate reason “There are lots of luxury
addresses in Hong Kong or Singapore, but these are less established markets [relative
to Paris and London] and there is still the scope for new prime localities to emerge”.
Because of this, the 12 cities that were
being recorded experienced an average annual price growth of 6.6% in Q1 2011
compared to 12.7% a year earlier.
“Our view is that the next property cycle
– which has already started – will see the consolidation of an elite tier of
global city markets, where the top addresses will become increasingly fought
over by wealthy buyers as stores of value and long-term secure investments,” Bailey
further muses, “Values will rise from here. It won’t be a steady upward path,
and there are some considerable risks out there – from sovereign debt in the
West to asset bubbles and hot money in the East. But in the last two years the
highest price achieved in the global market has breached the £6,000/sq ft (£557
per sq m) barrier. The £10,000/sq ft (£929 per sq m) barrier will be breached
at some point this decade. My view is that it won’t happen in Asia – the first
market to break this barrier will be London.”
|
Rank |
City |
Annual % change (Mar 10-Mar 11) |
Six-month % change (Sept 10-Mar 11) |
Quarterly % change (Dec 10-Mar 11) |
Latest data if not Q1 2011 |
|
1 |
Paris |
22.2% |
10.0% |
0.0% |
|
|
2 |
Hong Kong |
15.0% |
7.5% |
6.4% |
|
|
3 |
Helsinki |
12.2% |
-3.5% |
0.1% |
|
|
4 |
Shanghai |
11.0% |
3.3% |
1.1% |
|
|
5 |
Beijing |
10.0% |
2.1% |
1.2% |
Q4 2010 |
|
6 |
London |
8.6% |
5.5% |
3.5% |
|
|
7 |
Singapore |
8.6% |
-1.5% |
-0.7% |
|
|
8 |
Zurich |
8.0% |
2.3% |
-0.3% |
|
|
9 |
Kiev |
3.2% |
-0.3% |
0.1% |
|
|
10 |
Geneva |
1.6% |
0.9% |
3.2% |
|
|
11 |
Monaco |
1.1% |
1.1% |
0.0% |
|
|
12 |
St Petersburg |
1.1% |
12.4% |
8.2% |
|
|
13 |
New York |
1.0% |
0.1% |
-9.6% |
|
|
14 |
Los Angeles |
-2.2% |
0.6% |
0.6% |
Q4 2010 |
|
15 |
Moscow |
-8.0% |
-2.3% |
-0.7% |
Q4 2010 |
Source: Knight Frank Residential Research, Orava Funds
(Oikotie Orava Index)
You can leave a response, or trackback from your own site.

Leave a Reply
You must be logged in to post a comment.